World Water Facts

How is your water trivia collection?   Are you ready to stun your friends with water facts?   If not, we can help.   Keep reading for a collection of facts that we will update every so often.
Water Supply

  • About 71% of the Earth’s surface is water-covered [1].
  • The volume of all water on Earth would be about 1,385 million cubic kilometers (km3) [1].   A cubic kilometer of water equals 1 trillion litres or 800,000 Olympic swimming pools.
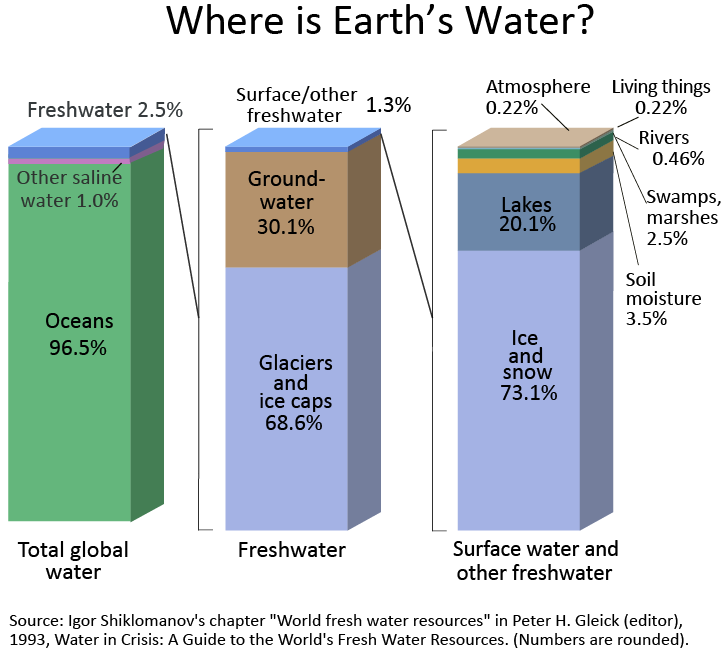
    • The oceans hold about 96.5% of all Earth’s water [1].
  • Freshwater is about 2.5% of all the Earth’s water [2].   Of the freshwater on Earth, much more is stored in the ground than is available in lakes and rivers.  Glaciers and ice caps hold about 68.7% of the freshwater with a further 30.1% is groundwater.
    • 68.7% of the Earth’s fresh water exists in the form of ice caps, glaciers and permanent snow cover which represents 1.74% of the total water volume [1].
    • About 31.4% of the world’s total freshwater supply is groundwater (this includes soil moisture, swamp water and permafrost) whereas only about 0.26% of total global fresh water is stored in lakes and rivers [1].
Vertical bars showing the water types (saline, fresh) of the total global; water supply, the location of the freshwater (cryosphere, groundwater, surface) and the locations of surface and other freshwater.
Relative proportions of planetary water supply. Source: USGS.

Water Demand

  • Noteworthy statistics [3]:
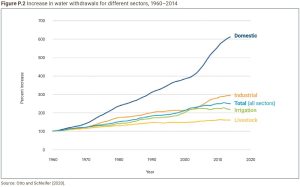
    • Freshwater use is growing by about 1% per year and sixfold over the past century [4].
    • Between 2002 and 2012, 1.4 billion people were affected by droughts.   Further, floods caused almost 100,000 deaths over the same period.
    • The big three water demands come from agriculture (~70%), industry (~20%) and domestic use (~10%).
    • 10-15% of global water withdrawals are for energy production.
  • Groundwater withdrawals represent about 50% of water withdrawn for domestic use and ~25% for agricultural use.   Groundwater storage is estimated to be depleted by 100-200 km3 per year [5].
  • Around 3,880 cubic kilometres of fresh water was withdrawn in 2017, up from around 600km3 in 1900.  is withdrawn annually from the world’s lakes, rivers and aquifers. This is twice the volume extracted 50 years ago [5].
  • Industry uses just under 20% of global freshwater withdrawals. However, the proportion varies significantly with a country’s level of economic development: 39% in “high income” countries and 3% in “low income” countries [3].
  • Irrigated agriculture represents 20 percent of the total cultivated land, but contributes 40 percent of the total food produced worldwide [6].
Graph showing increases in global water withdrawals from 1960 to 2014 for the following sectors: domestic, industrial, irrigation and livestock.
Global water withdrawals 1960-2014. Source: UN World Water Development Report 2024.

Scarcity 

  • About half the world’s population is affected by water shortages at least part of the year while some 25% of people experience “extremely high” water stress [3].
  • None of the Sustainable Development Goal 6 “Ensure availability and sustainable management of water and sanitation for all” targets appear to be on track in 2024 [3].
    • 2.2 billion people lacked safely managed drinking water as of 2022 [3].
    • 3.5 billion people lack safely managed sanitation [3].
  • 85% of the world’s wetlands have been lost in the last 300 years [7].
  • One-third of freshwater fish face extinction [8].
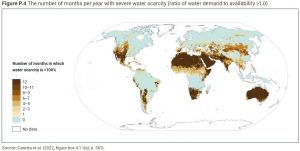
A colour-coded world map indicating the number of months in the year during which demand exceeds supply.
Months/Year of demand > supply. Source: UN World Water Development Report 2024.

Infrastructure

  • In 2021, Canada drinking water plants produced 4869 million cubic meters (over 1.9 million Olympic swimming pools) of drinking water.   88% of that came from a river or lake [9].
  • Desalination accounts for 26% of the energy use in the global water sector [3].
  • An estimated 346 km3 per year (~10% of total freshwater withdrawals) is estimated to evaporate from artificial lakes and reservoirs which is significantly higher than the evaporation from the original river [4].
  • There are estimated to be over 1 million barriers on Europe’s rivers [10].

Health and Sanitation

  • In 2019, 1.4 million deaths were attributed to poor water, sanitation and hygiene (WASH) [11].
  • In 2021, Canadians used an average of 221 litres of treated water per day for residential purposes [9]
  • Global costs of achieving SDG 6 are estimated to be more than USD1 trillion per year – approximately 1.2% of global GDP [3].
  • In 2015, it was estimated that the annual production of wastewater was 330 billion m3 (or 132 million Olympic swimming pools)  – this is five times the annual flow going over the Niagara Falls [11].   The Canadian average is estimated at 198 m3 per person.
  • An estimated 1 million people die from diarrhoea each year.  In 2021, more than 251 million people required treatment for schistosomiasis (a disease contracted through infected water) [12].
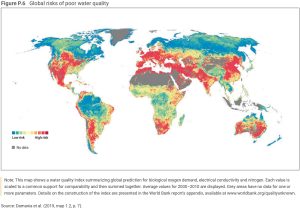
A world map indicating levels of water quality risk
Water quality risk. Source: UN World Water Development Report 2023.

Sources

  1. USGS, 2019, How much water is there on earth?.  https://www.usgs.gov/special-topics/water-science-school/science/how-much-water-there-earth.  Accessed 2024-11-28.
  2. USGS, 2018, Where is Earth’s Water?  https://www.usgs.gov/special-topics/water-science-school/science/where-earths-water.  Accessed 2024-11-28.
  3. UN Water, 2024, Water for prosperity and peace.  https://www.unwater.org/publications/un-world-water-development-report-2024.  Accessed 2024-11-28.
  4. UN Water, 2021, UN World Water Development Report 2021: Valuing Water.  https://www.unwater.org/publications/un-world-water-development-report-2021.  Accessed 2024-11-28.
  5. UN Water, 2022, Groundwater: Making the invisible visible.  https://www.unwater.org/publications/un-world-water-development-report-2022.  Access 2024-11-28.
  6. Food and Agriculture Organisation, n.d., Irrigation Management.  https://openknowledge.fao.org/server/api/core/bitstreams/522aaf39-a84d-4361-9cea-797d5f883118/content.  Accessed 2024-11-28.
  7. United Nations, 2022, The Sustainable Development Goals Report  2022.  https://unstats.un.org/sdgs/report/2022/The-Sustainable-Development-Goals-Report-2022.pdf.  Accessed 2024-11-28.
  8. International Union for Conservation of Nature, 2021, The world’s forgotten fishes.  https://wwfint.awsassets.panda.org/downloads/world_s_forgotten_fishes__report_final__1.pdf.  Accessed 2024-11-28.
  9. Statistics Canada, 2023, Survey of Drinking Water Plants, 2021.  https://www150.statcan.gc.ca/n1/daily-quotidien/231114/dq231114d-eng.htm.  Accessed 2024-11-28.
  10. European Investment Bank, 2023, No barrier to river biodiversity.  https://www.eib.org/en/stories/rivers-biodiversity-dam-removal-award.  Accessed 2024-11-28.
  11. United Nations Environment Program, 2023, Wastewater: Turning Problem to Solution.  https://www.unep.org/resources/report/wastewater-turning-problem-solution.  Accessed 2024-11-28.
  12. World Health Organisation, 2023, Drinking-water.  https://www.who.int/news-room/fact-sheets/detail/drinking-water.  Accessed 2024-11-28.
Photograph of WaterPortal Board Member Ross Douglas

Ross Douglas

Board Member

Ross has extensive executive experience in Operations, Governance, Information Technology and Strategy at the board and senior management level including Mancal Corporation, Mancal Energy, Highridge Exploration and Atlantis Resources. He has worked in Oil and Gas, Coal, Commercial Real Estate, Portfolio Management, Recreation, Retail and Water and Wastewater Treatment. His experience is also geographically diverse having overseen operations in Canada, the United States, United Kingdom and Northern Ireland. Additionally, he has been on the board of companies with operations in Argentina, Azerbaijan, Barbados, Kazakhstan, and Russia. He has served on numerous Public, Private and Not for Profit Boards across a number of industries.

Ross has been active on several industry Boards and committees including the Canadian Association of Petroleum Producers (CAPP) and The Schulich School of Engineering Industry Advisory Council at the Schulich School of Engineering.

Photograph of WaterPortal Board Member Brian Mergelas

Brian Mergelas, PhD, ICD.D

Board Member

Brian is a seasoned Cleantech entrepreneur with a proven history of successfully bringing complex water technologies to the market.   With over 25 years of experience, he has led various organizations to achieve significant milestones in the industry. 

Having started as the founding CEO of the Pressure Pipe Inspection Company (PPIC) and later taking the helm at the Water Technology Acceleration Project (WaterTAP), Brian’s entrepreneurial spirit has been instrumental in driving innovation and growth within the sector. 

He is an active investor in the cleantech sector and has served on many boards including the Ontario Clean Water Agency. 

Actively engaged in industry associations like AWWA, WEF, IWA, and ASCE, Brian enjoys collaborating with fellow professionals to promote advancements in the field. 

Brian holds an undergraduate degree and a PhD in Physics from Queen’s University, which has provided him with a solid technical foundation.   As a member of the Institute of Corporate Directors, he brings valuable insights to corporate governance.