Any discussion of climate change, climate variability or shifts in the weather must begin with an explanation of some important terms. The terms “variability”, “climate change”, and “global warming” have specific meanings, so it is important to break these down. The following definitions are from the Intergovernmental Panel on Climate Change Glossary [1] and will help you interpret the rest of this article:
| Climate: | In a narrow sense, climate is usually defined as the average weather, or more rigorously as the statistical description in terms of the mean and variability of relevant quantities over a period of time ranging from months to thousands or millions of years. The classical period for averaging these variables is 30 years, as defined by the World Meteorological Organization (WMO). The relevant quantities are most often surface variables such as temperature, precipitation and wind. Climate in a wider sense is the state, including a statistical description, of the climate system. |
|---|---|
| Climate variability: | Deviations of climate variables from a given mean state (including the occurrence of extremes, etc.) at all spatial and temporal scales beyond that of individual weather events. Variability may be intrinsic, due to fluctuations of processes internal to the climate system (internal variability), or extrinsic, due to variations in natural or anthropogenic external forcing (forced variability). |
| Cimate Change: | A change in the state of the climate that can be identified (e.g., by using statistical tests) by changes in the mean and/or the variability of its properties and that persists for an extended period, typically decades or longer. Climate change may be due to natural internal processes or external forcings such as modulations of the solar cycles, volcanic eruptions and persistent anthropogenic changes in the composition of the atmosphere or in land use. Note that the United Nations Framework Convention on Climate Change (UNFCCC), in its Article 1, defines climate change as: ’a change of climate which is attributed directly or indirectly to human activity that alters the composition of the global atmosphere and which is in addition to natural climate variability observed over comparable time periods’. The UNFCCC thus makes a distinction between climate change attributable to human activities altering the atmospheric composition and climate variability attributable to natural causes. |
Examples of recent hydroclimatic variability in Alberta are not hard to find. Key variables of the hydrological cycle, including temperature, evapotranspiration, precipitation and snow/ice, fluctuate in Alberta per large scale changes in climate like the El Nino Southern Oscillation (ENSO) and Pacific Decadal Oscillation, producing the variability that we experience year to year. As the climate changes, the range of variability we experience in weather and climate also changes.
As the atmosphere warms, it holds more energy and is able to hold more water. With every degree the atmosphere warms, it is able to hold 7% more water, based on the well-established Clausius-Clapeyron relationship (Christensen and Christensen 2003 [2]). This added energy and moisture means that key features of the planet, which have held the climate relatively stable and predicable, are no longer able to do this job. Variability is increased by rising surface temperatures also because heat increases the energy of the atmosphere, resulting in a generally more unstable atmosphere and greater movement of air. This increased variability can be at least partially explained by the concept of “stuck weather patterns”, whereby weakening of the temperature difference between the poles and equator means mid-latitude locations can see longer periods of more intense weather (Mann et al., 2017 [3]). The following graphs show how warming of North America’s summer climate has also had an associated increase in variability.
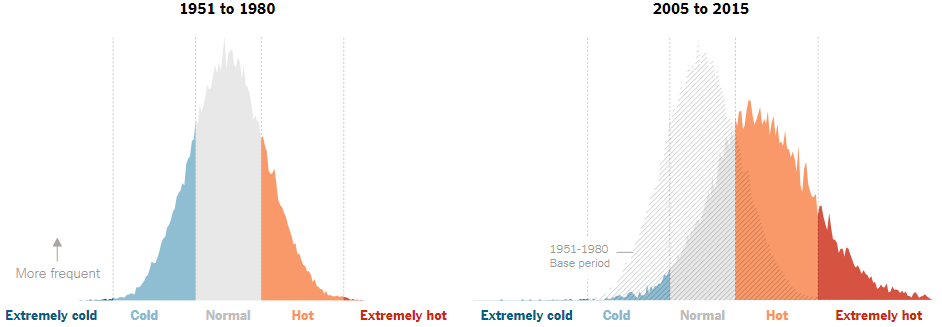
Over the last three decades alone Alberta has experienced massive floods and devastating droughts. During the period 1999-2004 a North American drought became one of Canada’s costliest natural disasters, while ten counties in Alberta declared a state of emergency during the drought of 2009-2010 and areas of Northern Alberta declared agricultural disasters. At the peak of the drought farms received only 60% of their allocated water (Sauchyn & Kulshreshtha, 2008 [4]). Floods in 2005 and 2013 are fresh in everyone’s mind, and even high vs low snow years are examples of climate variability. These events are not unusual for Alberta’s climate, although they can feel wildly out of the ordinary at the time. The prairies are actually characterized by these extreme swings as opposed to steadily average conditions, while Northern Alberta has one of the most variable climates in the world along with Siberia (Sauchyn, 2017 [5]). Based on this historical variability it is evident that the potential range of climatic conditions is far greater than those observed in recent history. Reconstruction of the paleoclimate using proxy records data indicate that our short instrumental record, which covers 100-200 years, doesn’t quite capture the full range of extreme events that are possible in this province. We need to understand the full range of extreme events because climate change will likely result in more of these events beyond those experienced during the instrumental record.
Paleoclimatic reconstructions tell the story of what Alberta used to look like hundreds and thousands of years ago. Earth’s climate as we know it today is merely a snapshot of the incredible range of climates that have existed on Earth over the last 4.5 billion years. At times in Earth’s history the planet would have been uninhabitable by most species alive today, while during others the climate may have been very similar to what we experience right now. In its first few millennia, Earth surface temperatures were likely more than 400°F. Ice sheets covered the surface from poles to equator between 600 and 800 million years ago. Only continual movement of tectonic plates during this deep freeze and associated volcanic activity, which contributed to an early greenhouse effect on the atmosphere, brought temperatures up enough to thaw the frozen planet (Scott & Lindsey, 2014 [6]). Since then the Earth has frozen and thawed numerous times, with the most recent ice age ending a mere 11,000 years ago (Figure 2).
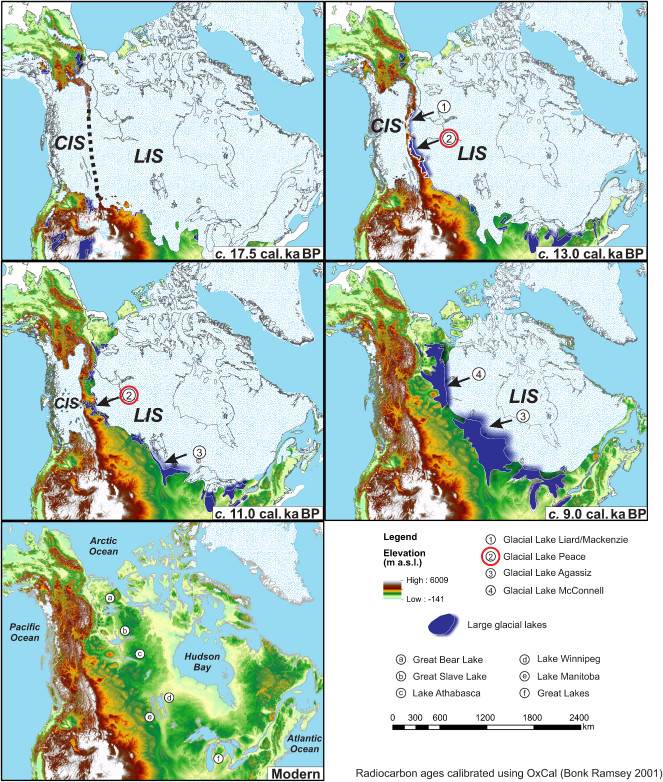
Weather and climate systems have existed for billions of years, shaping and reshaping the surface of the Earth in concert with other geological, biological, and physical processes. Piecing together the climate of the past, known as paleoclimatology, enables us to understand Earth processes, including climate systems, on much larger timescales than those of the instrumental record.
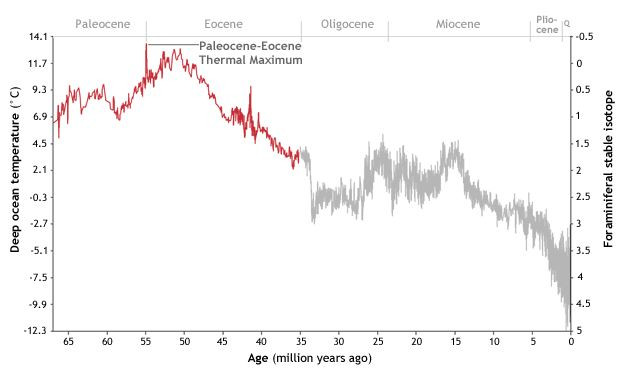
Most paleoclimatic reconstructions range from hundreds to thousands of years before present, each contributing different levels of understanding to our knowledge of Earth’s climate systems. Older reconstructions, like those of the Holocene beginning ~10,000 years ago at the end of the last glaciation, are valuable for understanding how a different global climate influenced regional hydrology and ecology of the landscape we see today. During the mid-Holocene, known as the Hypsithermal period, temperatures in Alberta were approximately 2 degrees higher than they are today (Schneider, 2013 [7]; Vance, Beaudoin & Luckman, 1995 [8]). Conditions during the Hypsithermal were substantially drier, from both increased evapotranspiration (from higher temperatures) and lower precipitation. Most lakes in the grasslands and parklands were dry, and active sand dunes were present. Increased rates of fire in the Foothills and Rocky Mountains followed upslope movement of tree species. Lake Manitoba in southern Manitoba was completely dry during this period, and there were far fewer wetlands across all prairie regions (Schindler & Donahue, n.d. [9]). Most water bodies in the Palliser Triangle region were also dry, with low water levels in Parkland regions to the north (Schneider, 2013 [7]).
Reconstructions of the last two thousand years can be used to investigate variability in climate parameters when the global climate was comparable to the one we know today. These reconstructions are especially valuable because this period was characterized by hydroclimatic extremes, floods and droughts, which are predicted impacts of climate change. Since there were no written records of the surface temperature, snow pack, streamflow, etc. from beyond two hundred years ago that can be analyzed for climatic trends, scientists must use natural recorders of climate variability, known as proxy indicators, to reconstruct hydroclimatic conditions of the paleoclimate (Figure 4).
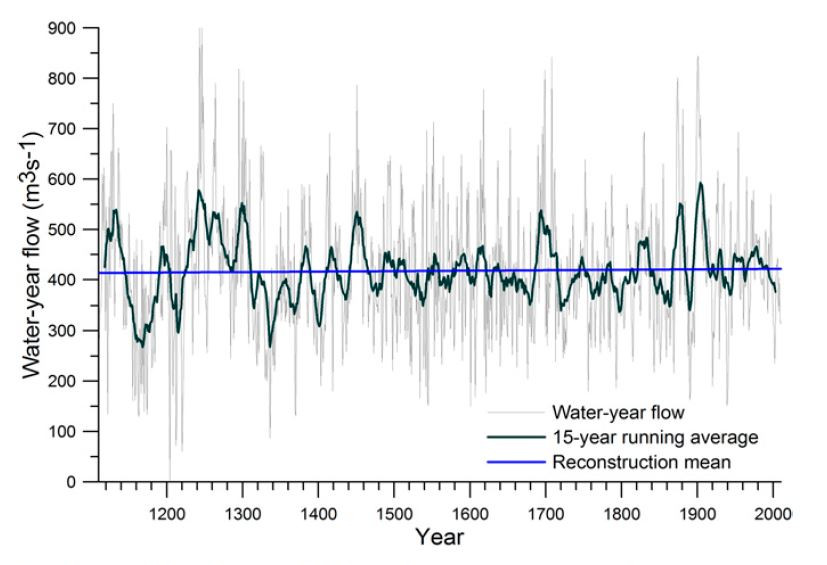
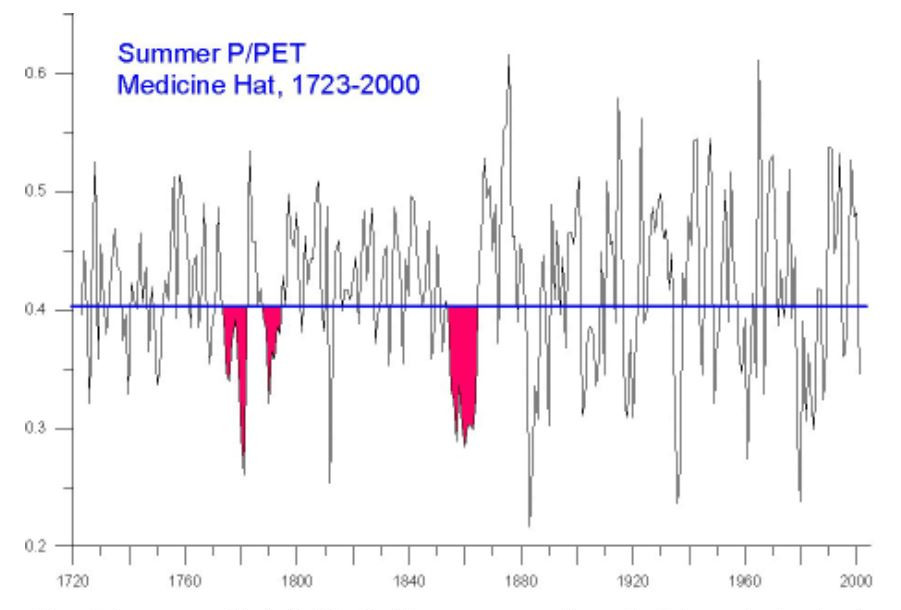
Proxy data from tree rings, lake sediment, sand dune activity and pollen in lake sediment have all been used to reconstruct Alberta’s historical climate. Paleoclimatic reconstructions of Southern Alberta during the last two millennia indicate prolonged periods of aridity, with longer and more severe droughts than any observed in the instrumental record (Figure 5). Based on records from these indicators, Southern Alberta was settled during a very unusual, and very wet, climatic period. Streamflow reconstructions demonstrate that the 20th century in the North Saskatchewan River experienced fewer drought episodes than the previous 10 centuries. Based on these data the 20th century average flows for the South Saskatchewan, North Saskatchewan, and Saskatchewan Rivers are all higher than the long-term averages calculated over the last 500 years. During the first half of the 1700’s extreme hydrological drought impacted streamflow for all these rivers, to a degree that has never been experienced in the instrumental record, while prolonged low flow conditions during 900-1300 A.D. also surpass any long-term hydrologic drought conditions observed in recent history (Sauchyn, Barrow et al, 2002 [10]).
Global temperatures are rising, with December marking the 384th consecutive month with a global temperature above the 20th century average (Sauchyn, 2017 [5]). It is now widely accepted that human influence on the atmosphere is an important factor influencing this upward trend. Managing the additional variability that results from a warmer climate is a challenge for water management. This is because the fluctuations that are possible in hydrologic variables, like streamflow, are expected to exceed the limits to which we have designed our infrastructure and management practices, including critical natural watershed features.
Current water infrastructure and management practices in Alberta consider the observed, natural variability of our climate, but must begin to also address increasing changes in variability due to climate change. Planners and builders understand that Alberta is prone to wide variability in water availability and hydrologic conditions from year to year, so rivers are regulated with dams and reservoirs, crops are irrigated, and floodzones are mapped out. In many cases, especially for engineered structures, an upper (or lower) limit is established, beyond which the infrastructure and plans may be unable to operate, leading to potential crises or emergency situations. If there is a high chance a climatic event will exceed a chosen limit, a higher limit that is less likely to occur may be chosen to minimize the risk of system failure.
As an example, if a stormwater pond is designed to hold the equivalent of an extreme rainfall event that occurred historically once in a hundred years, but that same size storm now occurs more frequently, how do stormwater management plans need to change to accommodate that risk? That “once in a hundred years” event represents the frequency we were willing to accept the pond being overtopped when it was built. But if that event occurs more often, water managers need to determine if we are either willing to accept flooding more often, or change the way that stormwater pond is managed.
Generally, limits represent extreme cases that have very low likelihood of reoccurrence. In most cases, determining the likelihood of occurrence (how often something is expected to happen) is based on statistics for data that were collected over recent history using modern measurement techniques. To put it simply, we have built and planned based on what we have observed. However, those statistics are changing due to climate change, meaning our limits may be exceeded more often, increasing the risk that infrastructure and management plans are unable to function as designed.
There is no single answer, or even collection of answers, that can accurately predict what will happen to water in Alberta as our climate changes. Hydrological response to climate change varies at a local and regional scale, with each basin and sub-basin responding differently to changes in climate parameters. Global climate models (GCMs) lack the spatial and temporal resolution necessary for predicting regional impacts of climate change, nor can they be used to simulate the effects of these changes on the hydrologic cycle. Regional climate models (RCMs) cover smaller regions than those of the GCMs and may be more beneficial in some cases, but are not final answer. Translating our understanding of global anthropogenic induced climate change to relevant local changes in watershed dynamics requires the use of both global and regional climate scenarios, derived from GCMs and RCMs, combined with watershed scale hydrological models.
Results of watershed-scale hydrological models in Alberta generally suggest that climate change will impact the hydrologic regime in the following ways:
On average, the amount of precipitation received annually (whether as rain or snow or both) in Alberta is predicted to increase (Schneider, 2013 [7]). An important consideration is that predictions of increased precipitation may not directly result in predictions of increased water availability, because the timing of precipitation throughout the year is expected to vary significantly between the major river basins. This is partly due to the predicted changes in temperature, which will impact when it rains vs snows, and melts vs doesn’t. For instance, more snow in the winter could translate into more water available through the year as it melts, but the timing of the melt will determine how much water is seen at what time of the year.
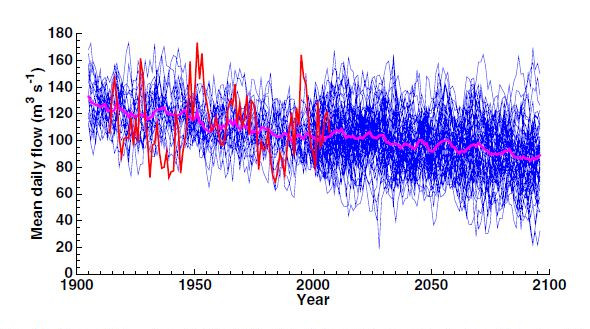
For Southern Alberta, in watersheds fed predominantly by mountain snowpack of the Eastern Rocky Mountains, earlier snowmelt resulting from higher temperatures is predicted to result in earlier spring freshet (high water levels from rapid spring melt) and lower late summer and early fall flows (Kienzle, Nemeth et al, 2012 [11]; Sauchyn, St Jacques et al., 2016 [12]). Higher winter flows are predicted for mountain watersheds, as temperatures during the cold season are also predicted to increase. Drought conditions in the prairies downstream, which are already part of the natural climate cycle, may be exacerbated by increased temperatures. Many areas within the prairies are drained internally by intermittent streamflow and minimal runoff, and rely heavily on the rivers originating to the West, making them vulnerable to drought in the event of reduced streamflow in late summer and fall. Overall lower annual flows are predicted for some basins, including the Oldman River Basin, supported by flow simulations for rivers such as the Oldman (Figure 6). In addition to these longer term trends in flow, the frequency and severity of extreme floods as well as droughts is predicted to increase in the prairie regions of Alberta, Saskatchewan and Manitoba (Sauchyn & Kulshreshtha, 2008 [4]).
Share this Post:
We provide Canadian educational resources on water practices to promote conservation and sustainability. Our team crafts current and relevant content, while encouraging feedback and engagement.
The Canada WaterPortal is a registered charity, #807121876RR0001
We recognize and respect the sovereignty of the Indigenous Peoples and communities on whose land our work takes place.
© 2025 All Rights Reserved.